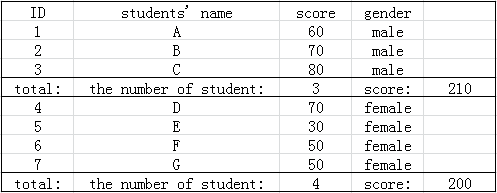
There are various options to implement, using Tersus, a display similar to the following:
One option is as follows:
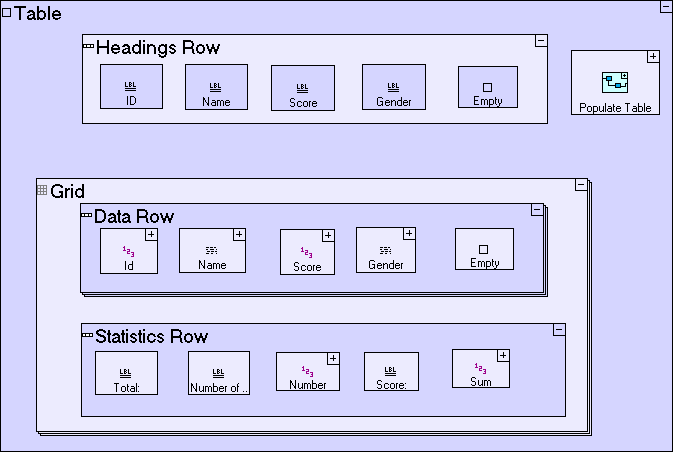
Note the repetitive grid, containing a repetitive data row - each instance of the grid will contain a subset of data rows with the matching statistics row.
You will want to specify some styling to make sure the headings and multiple grids align their columns (in the sample you included, there are 2 instances of the grid - one for male, the other for female students) - the main property to address is the html.cellWidth property which should be assigned a local value in each element in each of the rows - for more details see http://www.tersus.com/#Id=981 & http://www.tersus.com/#Tag=Client%20Design
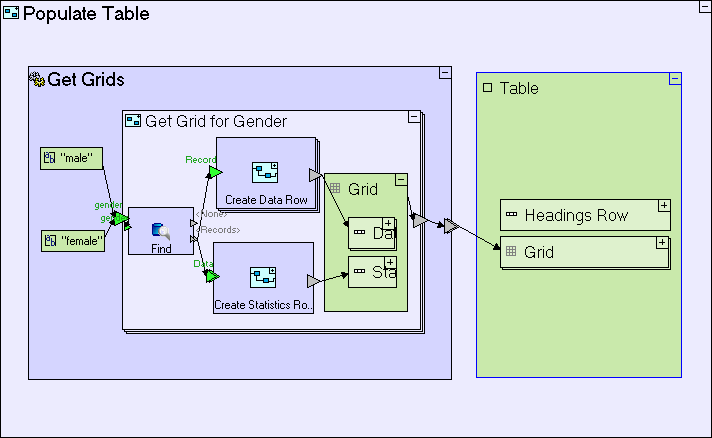
The Populate Table process rmay retrieve the data subsets filtered appropriately (by gender in the specific demo), and create a grid for each subset, as in the following:
I hope this provides you with some hints and ideas allowing you to proceed with your actual implementation.
Regards,
David
To use the full functionality of this web site, JavaScript needs to be turned on.
For best results, use the Firefox browser..
Copyright © 2003-2026 - Tersus Software Ltd., All rights reserved. Terms of Use License Graphic design by EmaraDesign